Technical Analysis
Reading the market's tea leaves, one chart pattern at a time. Master price action, indicators, and chart structures.
Technical Analysis Write-Ups

Stock Trading
Everybody Do the Volatility Squeeze
Today’s Workshop topic is a tight one – quite literally! We’re looking at the concept of a Volatility Squeeze and the ways of identifying one; primarily, Bollinger Bands and Keltner Channels! If you’ve ever wondered exactly how you can find a period of oddly low price volatility, then this is the article for you, as that’s exactly what we’ll be delving into with volatility squeeze!

Stock Trading
Fibonacci and the Golden Ratio: When Nature Meets Economics
Though plenty of methods are used to find support and resistance, a particularly interesting one is Fibonacci Analysis. Using the titular Fibonacci sequence, you can identify support and resistance levels with a bit of fancy math. Even if math isn’t your favourite thing, this sequence is a surprisingly fun way to find some handy trends!

Stock Trading
How Accumulation and Distribution Can Give You the Trading Edge
A stock’s trading cycle can typically be broken up into four stages: Accumulation, Markup, Distribution, and Markdown. These are all worth examining in their own right, but today, we’re going to focus on two in particular: Accumulation and Distribution. Fittingly enough, this article will be distributing some knowledge for you to accumulate.

Stock Trading
The Basics of Support and Resistance
Even in the tirelessly evolving realm of trading, the core concepts have remained remarkably stable since its inception. The most intriguing concept of patience, for one, but that will be tackled at a later date. This write-up is dedicated to support and resistance levels as one of the most crucial factors influencing trading decisions. And what is so important about support and resistance?

Algorithmic Trading
Algo Play: Blending Volatility & Momentum with a Moving Average (VolMo MA)
We blend short, medium, and long EMAs based on volatility (ATR) and momentum (RSI) to create a dynamically responsive indicator. The result, what we call a Volatility-Momentum MA improves trend detection and provides more effective trading signals in volatile and momentum-driven markets.

Stock Trading
AVWAP: A Whole New VWAP
We’ve talked about VWAP before, but only in its standard form. Today, we’re going to mix things up a bit by examining a variant of VWAP – specifically, AVWAP, or the Anchored Volume Weighted Average Price. What’s the difference between the two? How is AVWAP used in trading? I’ll be answering those questions today, as well as a few you didn’t even know you had!

Stock Trading
Volume Profile and Nodes of All Volumes
Another workshop, another handy technical analysis tool for us to explore. Today, we’re going to really dig into Volume Profile and two of the things that are such a key part of it: High-Volume and Low-Volume Nodes. It’s a great follow-up to some of our previously examined concepts, so be sure to read up on those earlier ideas if this article gets you itching for more trading!

Stock Trading
The Basics of VWAP
Trading is an ever-evolving thing, but there are some concepts that can usually be relied on to gain further insight into how you can make the best calls. One of those concepts is VWAP, which could make a world of difference in how you approach a trading decision. But what’s so important about VWAP? How about the fact that it can help find exit and entry points and serve as an indicator for how big investors are trading — and that’s just the start!

Momentum
MACD: A Super Extensible Price Action Navigator
The MACD (Moving Average Convergence Divergence) pinpoints buy and sell signals by tracking the interplay between short-term and long-term moving averages. Supercharge it (and your trading), by integrating adaptive EMAs, volume weighting, and multi-layer analysis. These power-ups make the MACD more responsive and accurate, giving you a fresher edge over other traders using the vanilla version of it.
Algorithmic Trading
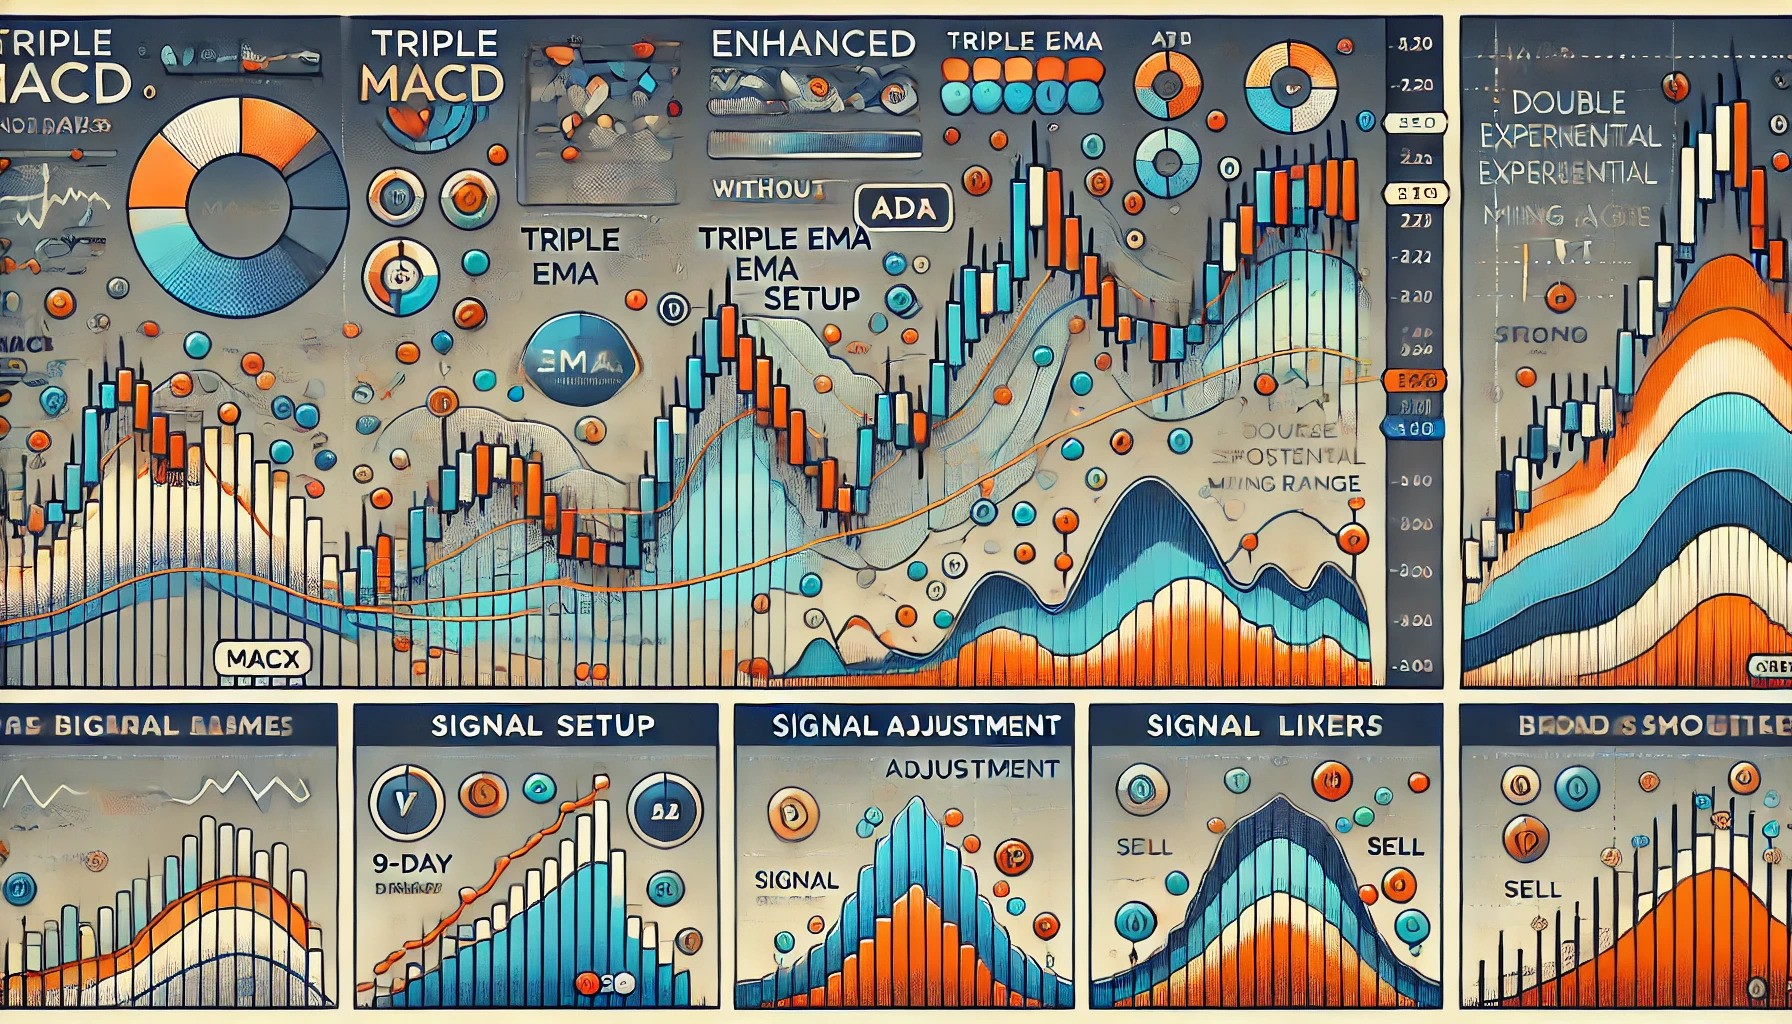
Algo Play: Turbocharging MACD with ATR, DEMA, and ADX
We’ve souped up the ol’ MACD with Triple EMAs (9, 21, and 50-day), ATR for volatility, DEMA for signal smoothing, and ADX for trend strength. This here fancy MACD is now as sharp as a tack, giving you crystal clear buy and sell signals while cuttin’ through all that market noise.