
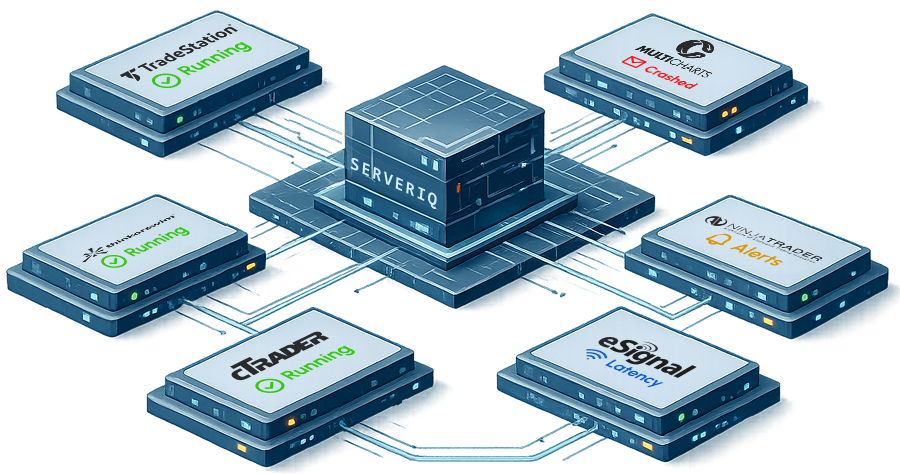
SERVERIQ BY CHARTVPS
Know Before Your Platform Crashes
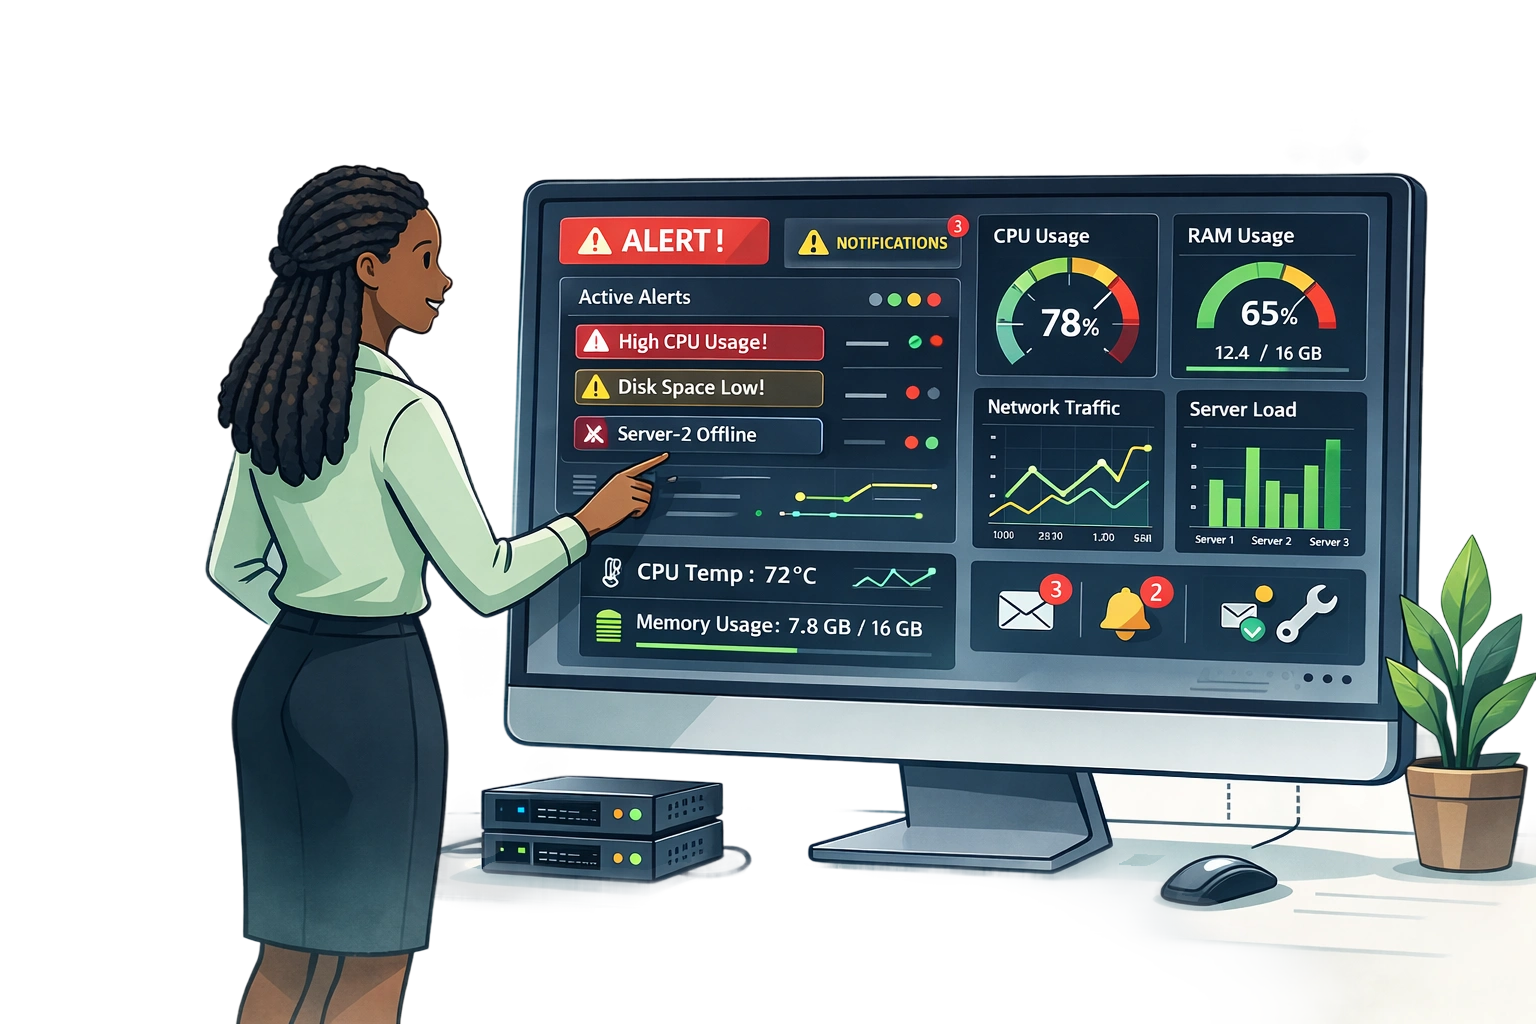
ServerIQ tracks CPU, RAM, disk, and network in real time, and watches the Windows processes your trading platforms run on. When a metric crosses your threshold or a platform crashes, it emails you in seconds.
99.99% Uptime
Real-time uptime monitoring with instant alerts to ensure maximum availability.
24/7 Monitoring
Continuous server health tracking including CPU, RAM, disk usage, and network performance.
< 5s Instant alerts
Instant alert notifications via email, SMS, or dashboard when anomalies are detected.
SERVERIQ
Key Features
Dashboard
Live overview of key metrics, system health, and performance trends in one unified view.
Track CPU Usage
Per-core load monitoring with real-time usage spikes, utilization history, and performance analytics.
Track RAM Usage
Memory allocation tracking with usage breakdown, cache visibility, and resource pressure insights.
Monitor Network
Real-time network monitoring with latency tracking, bandwidth usage, throughput analysis, and packet loss detection.
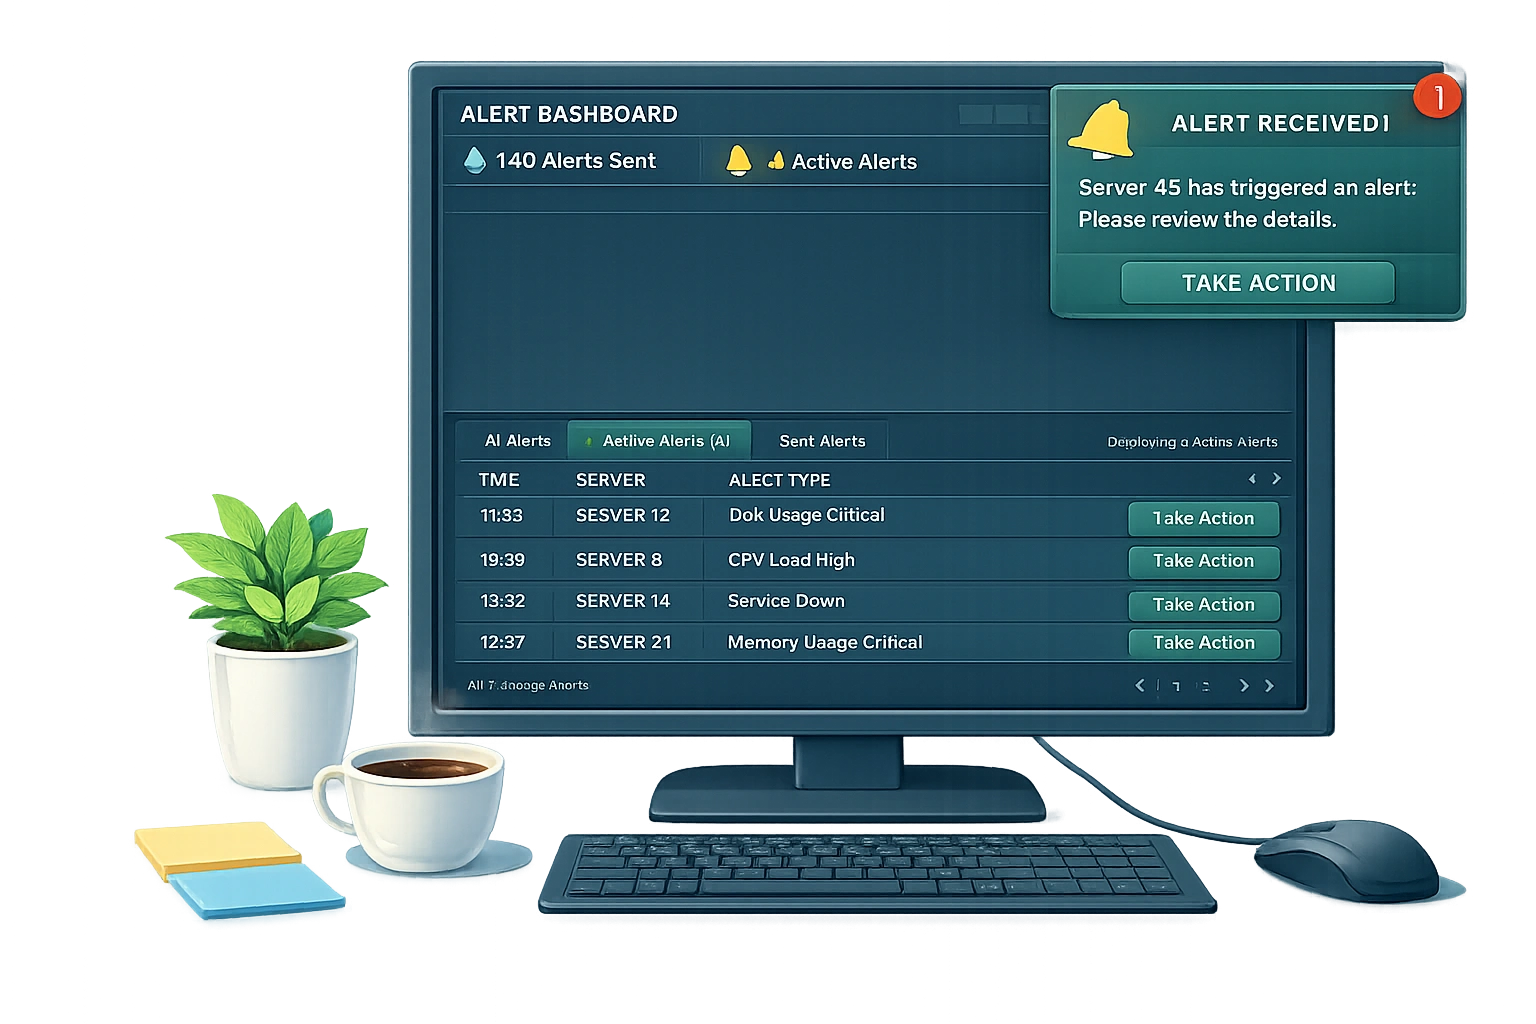
Alerting & Incidents
Detect threshold breaches, fire instant alerts, and log every incident with a timestamp so you can see what broke and when.
Notifications
Receive instant notifications via email, SMS, Slack, or custom integrations for critical events.
Audit Windows Processes
Monitor running services, background tasks, system processes, and track configuration or status changes.
Integration
Connect third-party tools, sync alerts, automate workflows, and centralize operational visibility in one place.
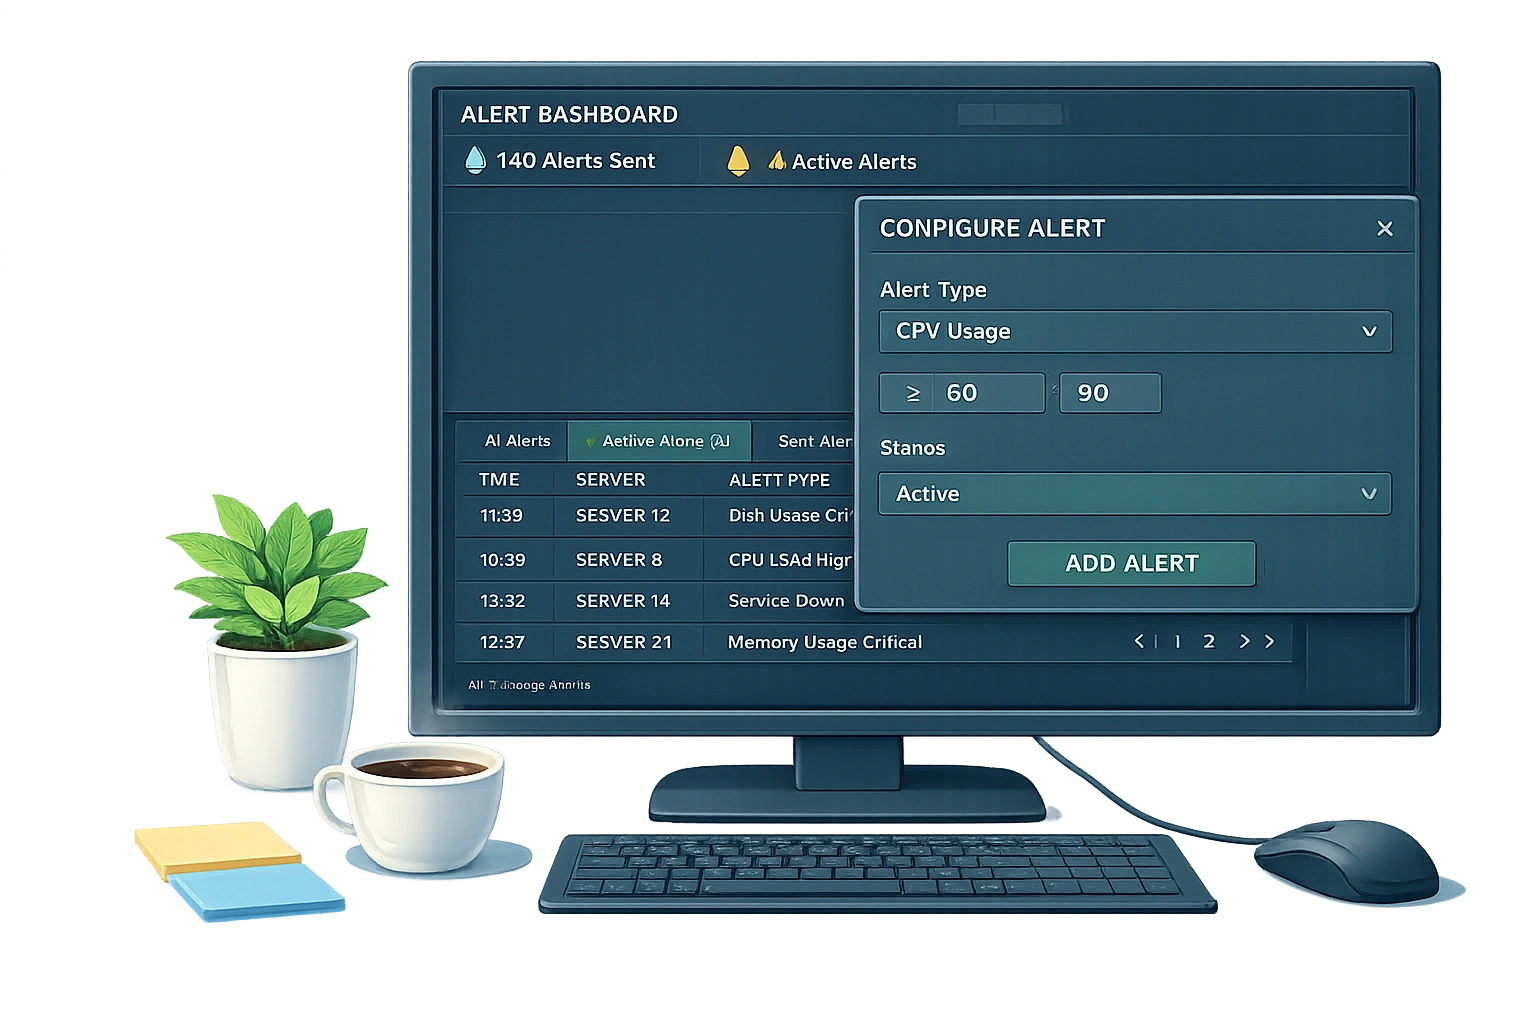
Settings
Customize monitoring rules, thresholds, alert policies, user roles, and advanced configuration preferences.
HOW IT WORKS
Server Monitoring
ServerIQ gives you real-time insight into your server's performance. Track CPU load, memory usage, disk activity, and network throughput from a single dashboard.
HOW IT WORKS
Server Monitoring
ServerIQ gives you real-time insight into your server's performance. Track CPU load, memory usage, disk activity, and network throughput from a single dashboard.
FREE WITH EVERY PLAN
ServerIQ is included with every ChartVPS plan at no extra cost.
Alpha, Gamma, or Delta - every plan ships with ServerIQ. Get real-time monitoring, instant alerts, and detailed performance insights from day one.
ALREADY A CLIENT?
Running with ChartVPS already? ServerIQ is yours too.
ServerIQ is included with existing subscriptions as well. Reach out to support via live chat or ticket and we'll make sure it's active on your VPS.
SMART ALERTS
Smart Alerts for Serious Uptime
Instant Email Alerts
24/7 CONTINUOUS ALERT MONITORING
ServerIQ emails you the moment something matters: a CPU, RAM, or storage limit is crossed, the server reboots unexpectedly, or one of your trading platforms crashes. You hear about a stalled feed or a dead platform in seconds, not after your strategy has already missed fills.
Configurable Alerts
ADVANCED ALERT AUTOMATION ENGINE
Customize your ServerIQ experience to safeguard your trading strategies. Define bespoke thresholds for system metrics, like CPU usage above 95% or RAM utilization over 80%, and get prompt email alerts. Configure notifications for particular events, such as aNinjaTrader crash, to suit your operational requirements.
Set the rules once and ServerIQ watches for them, so the alerts you get match the way you trade.
PERFORMANCE REVIEW
Review Performance with Full Operational Visibility
Monitor trends through clear graphs, examine system activity with audit history, and investigate events using detailed logs. Stay informed on how your server performs over time and respond faster with the insights needed for consistent uptime and smoother trading operations.
99.99%
UPTIME TRACKED
24/7
AUDIT MONITORING
1200+
ISSUES LOGGED
250+
AUDIT REPORTS
SERVERIQ
Instantly aware, never miss a beat
ServerIQ watches CPU, RAM, disk, network, and your trading platform processes around the clock, then emails you the second one of them goes wrong.
From CPU spikes to network anomalies, ServerIQ detects issues in real-time and notifies you before they impact your trading strategies.
Hundreds of traders run ServerIQ on their servers 24/7, so a stalled feed or a crashed platform reaches them in seconds, not hours.
Get StartedSTEP BY STEP GUIDE
ServerIQ Walkthrough
Usage
23%
Cores
8
Clock
4.90 GHz
Processes
142
CPU Usage — Last 6 Hours
Per-Core Usage
C0
34%
C1
18%
C2
45%
C3
12%
C4
28%
C5
8%
C6
22%
C7
15%