NEXT Stochastic 3xVW™
Overview
This responsive version of the Stochastic oscillator modifies and extends the original to incorporate volume. It does so on 2 levels: by using Volume-Weighted Moving Average (VWMA) as input and applying a triple volume weighting filter within the internal algorithm, intelligently blending volume with what is otherwise pure momentum/distribution analysis. The result is more binary-like curve behavior (%K and %D oscillator lines), whose polarizing movement acts as both a signal and filter.
Key Features
- User-configurable triple volume-weighing algorithm
- Low to no lag, smoothed Stochastic %K and %D lines
- Native alerts via TradingView, including %K/%D crossovers
- Integrates with NEXT Strategy Visualizer
- Free, available for TradingView – a free platform
Input Parameters
- VWMA Length – controls the averaging length of the volume-weighted moving average (based on close price and volume); used as Stochastic input
- %K Length – volume-driven averaging length of the %K oscillator line – this is the faster of the two Stochastic lines
- %K Smoothing – volume-driven smoothing factor of the %K line
- %D Smoothing – volume-driven averaging length of the %D oscillator line (a %K derivative, post smoothing) – this is the slower of the two Stochastic lines
- Upper Limit – the NEXT Stochastic 3xVW level above which market is considered overbought, default is 80
- Base Bias – the NEXT Stochastic 3xVW level above which market bias is considered bullish, and below bearish
- Lower Limit – the NEXT Stochastic 3xVW level below which market is considered oversold, default is 20
Strategies
Valuation, Bias, and Divergence Play
NEXT Stochastic 3xVW is intended to be used like the original Stochastic oscillator within the context of technical analysis: identifying overvalued (above upper limit) and undervalued (below lower limit) price action, as well as establishing a bias baseline (bullish if over 50; bearish if under 50). Higher NEXT Stochastic 3xVW bottoms compared to lower price bottoms signify bullish divergence; lower NEXT Stochastic 3xVW tops compared to higher price tops signify bearish divergence. Trading %K/%D line crossovers is also a popular strategy, with %K crossing over %D indicating bullish sentiment and %K crossing under %D indicating bearish sentiment.
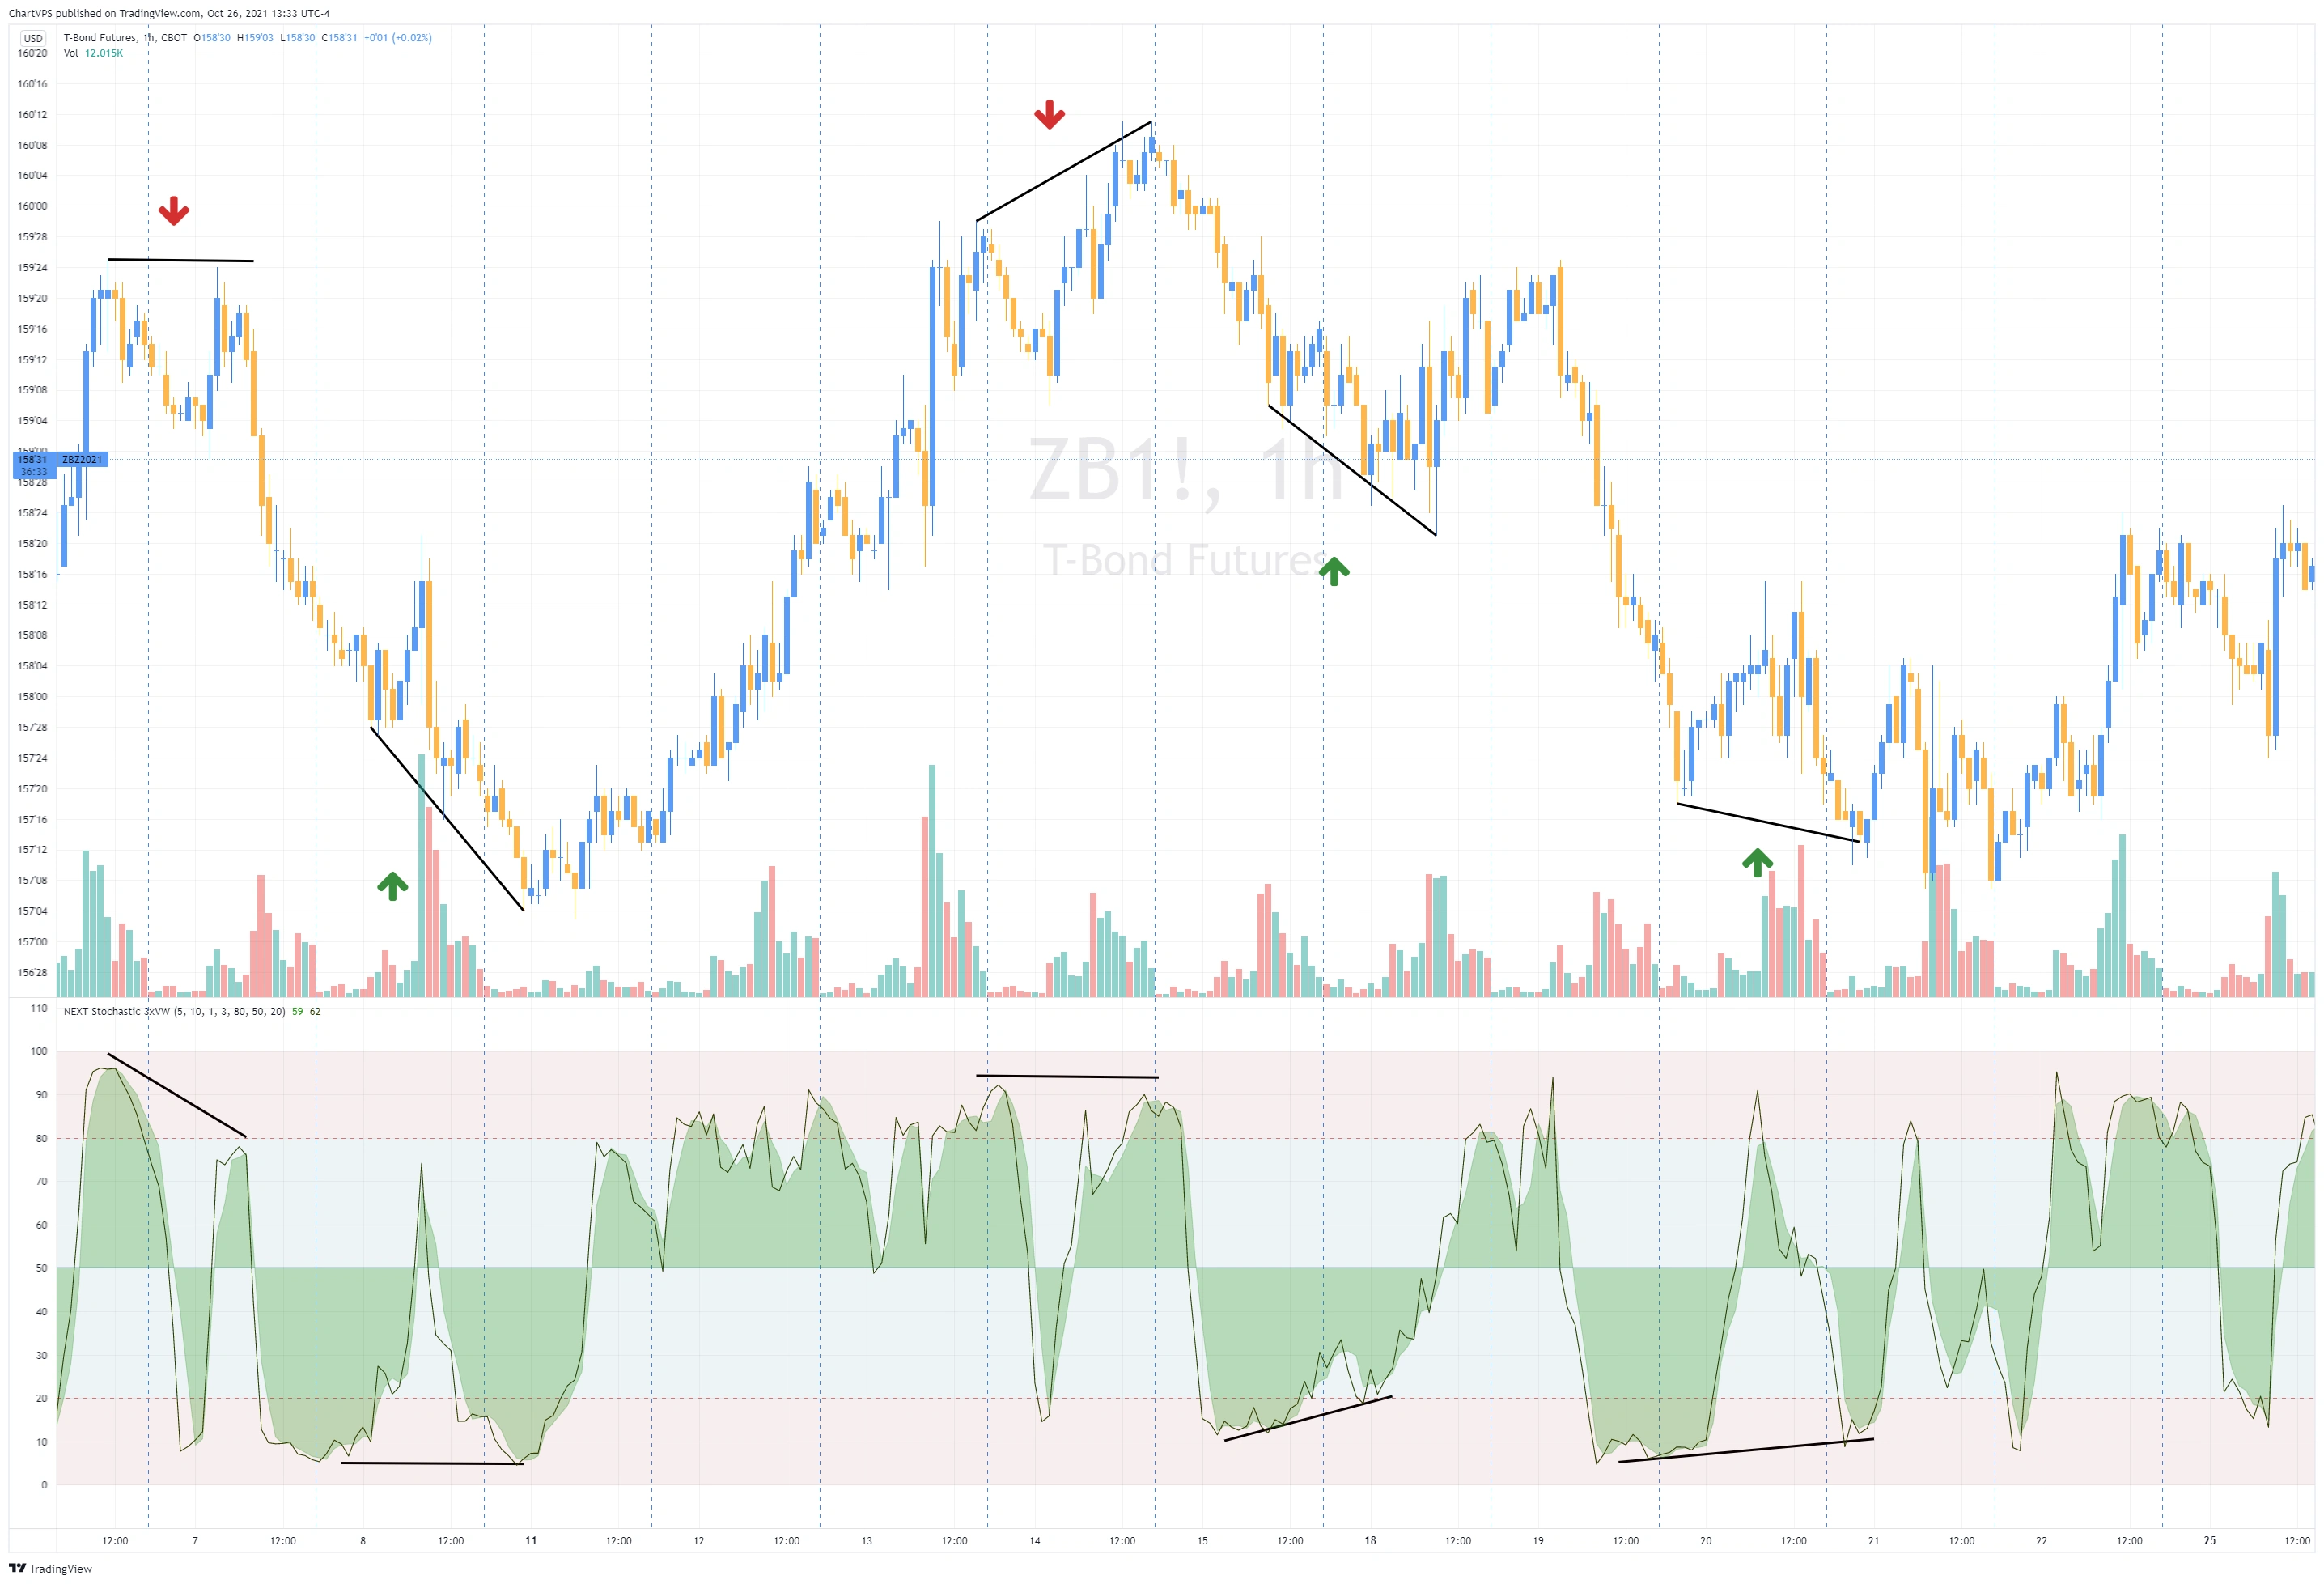
Divergence Play on ZB (30 year T-Bond Futures) 1-Hour Chart
- NEXT Stochastic 3xVW is a low-lag, triple volume-weighted momentum oscillator
- Use as you would other divergence strategies: higher price highs, lower NEXT Stochastic 3xVW highs = bearish; lower price lows, higher NEXT Stochastic 3xVW lows = bullish
- Use a preset TP / SL and/or close if NEXT Stochastic 3xVW retraces back to last relevant high or low. Alternatively, use %K/%D line crossovers to exit
- Interactive ZB strategy chart and full details on our TradingView Idea page.
Trading Overbought/Oversold Levels
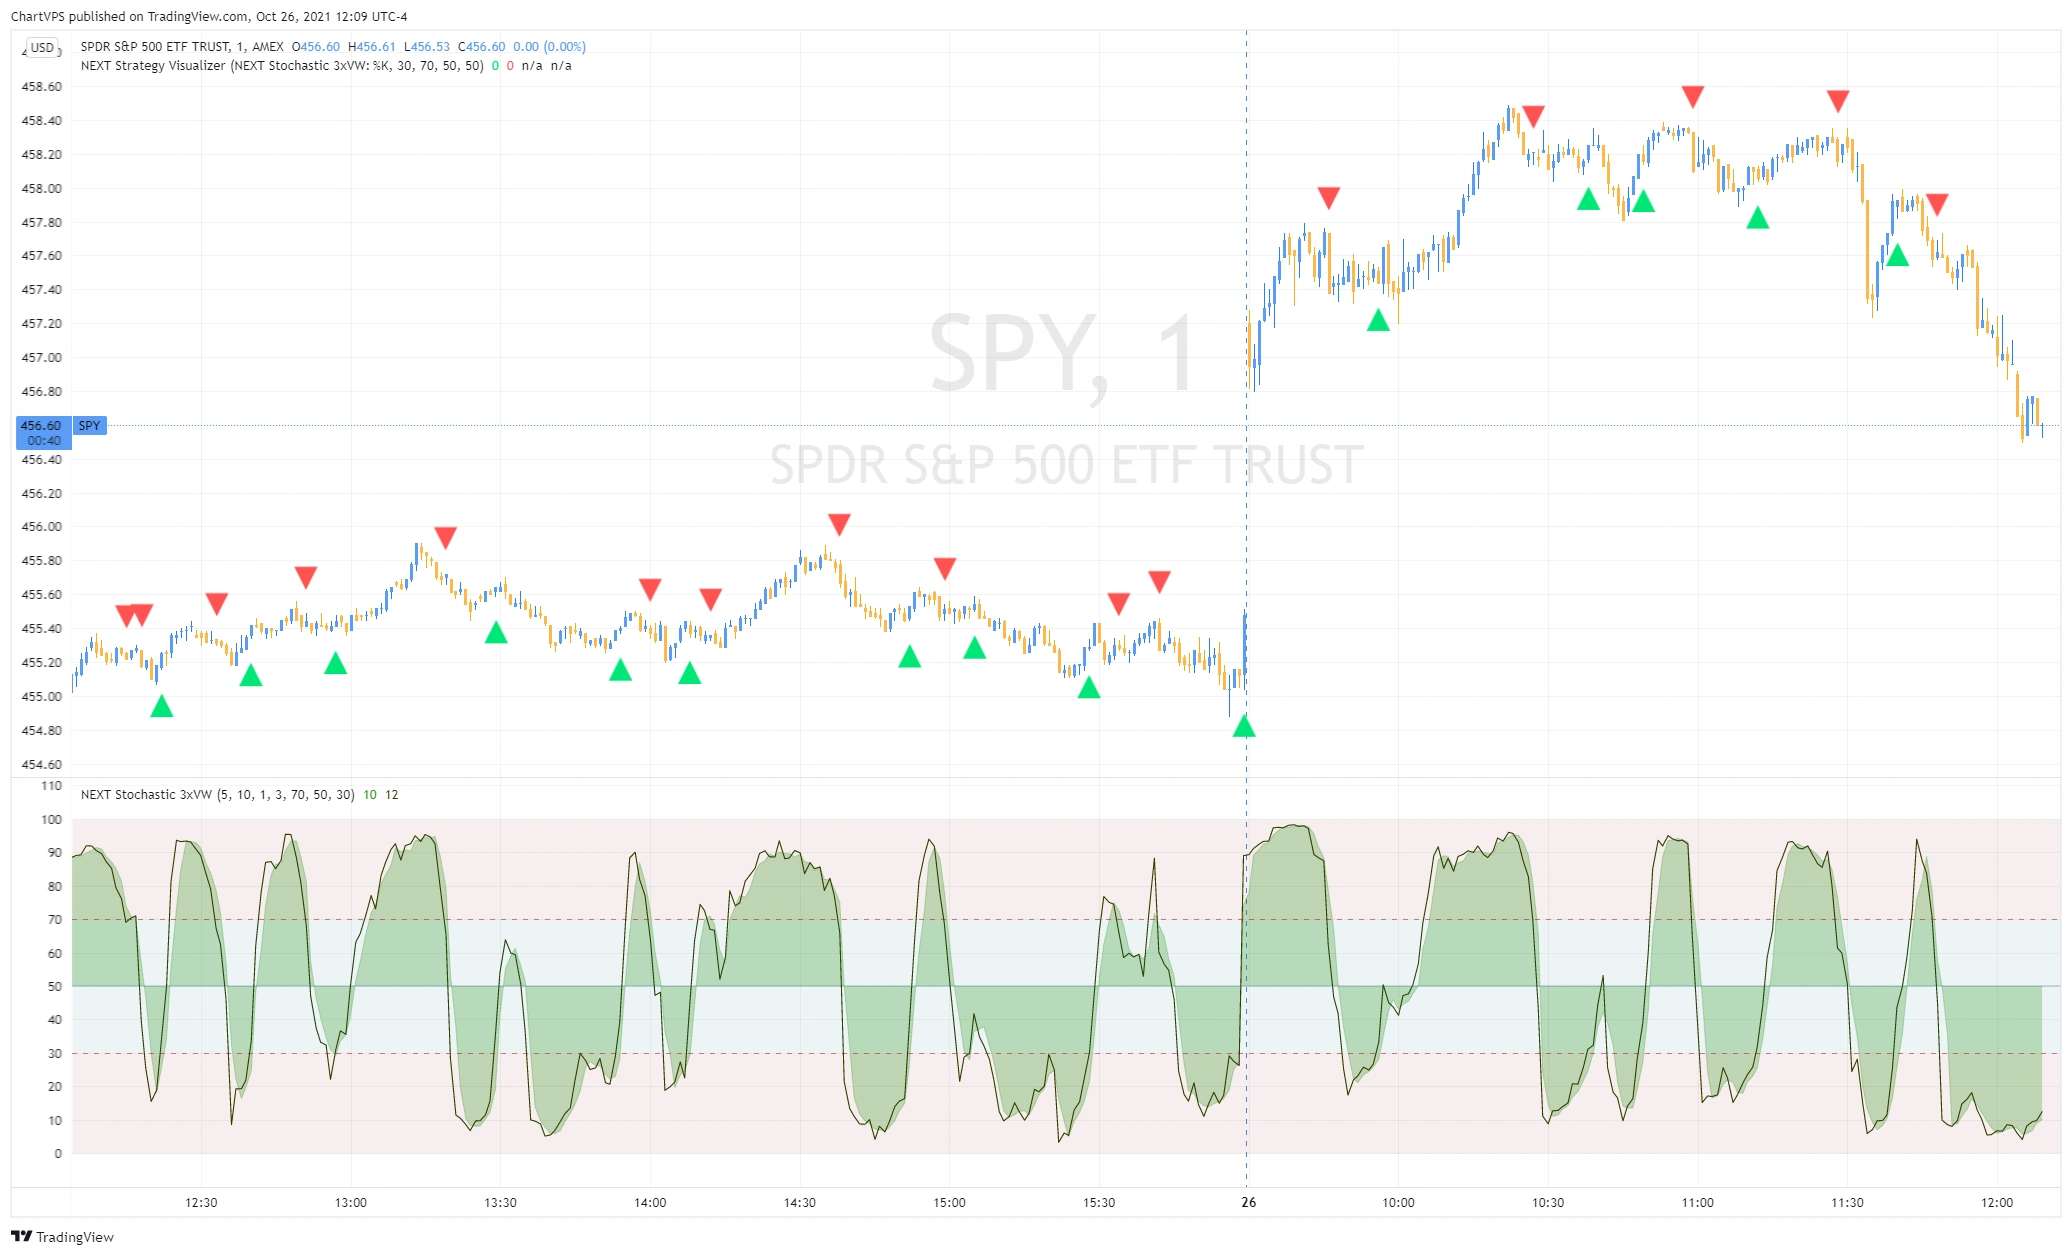
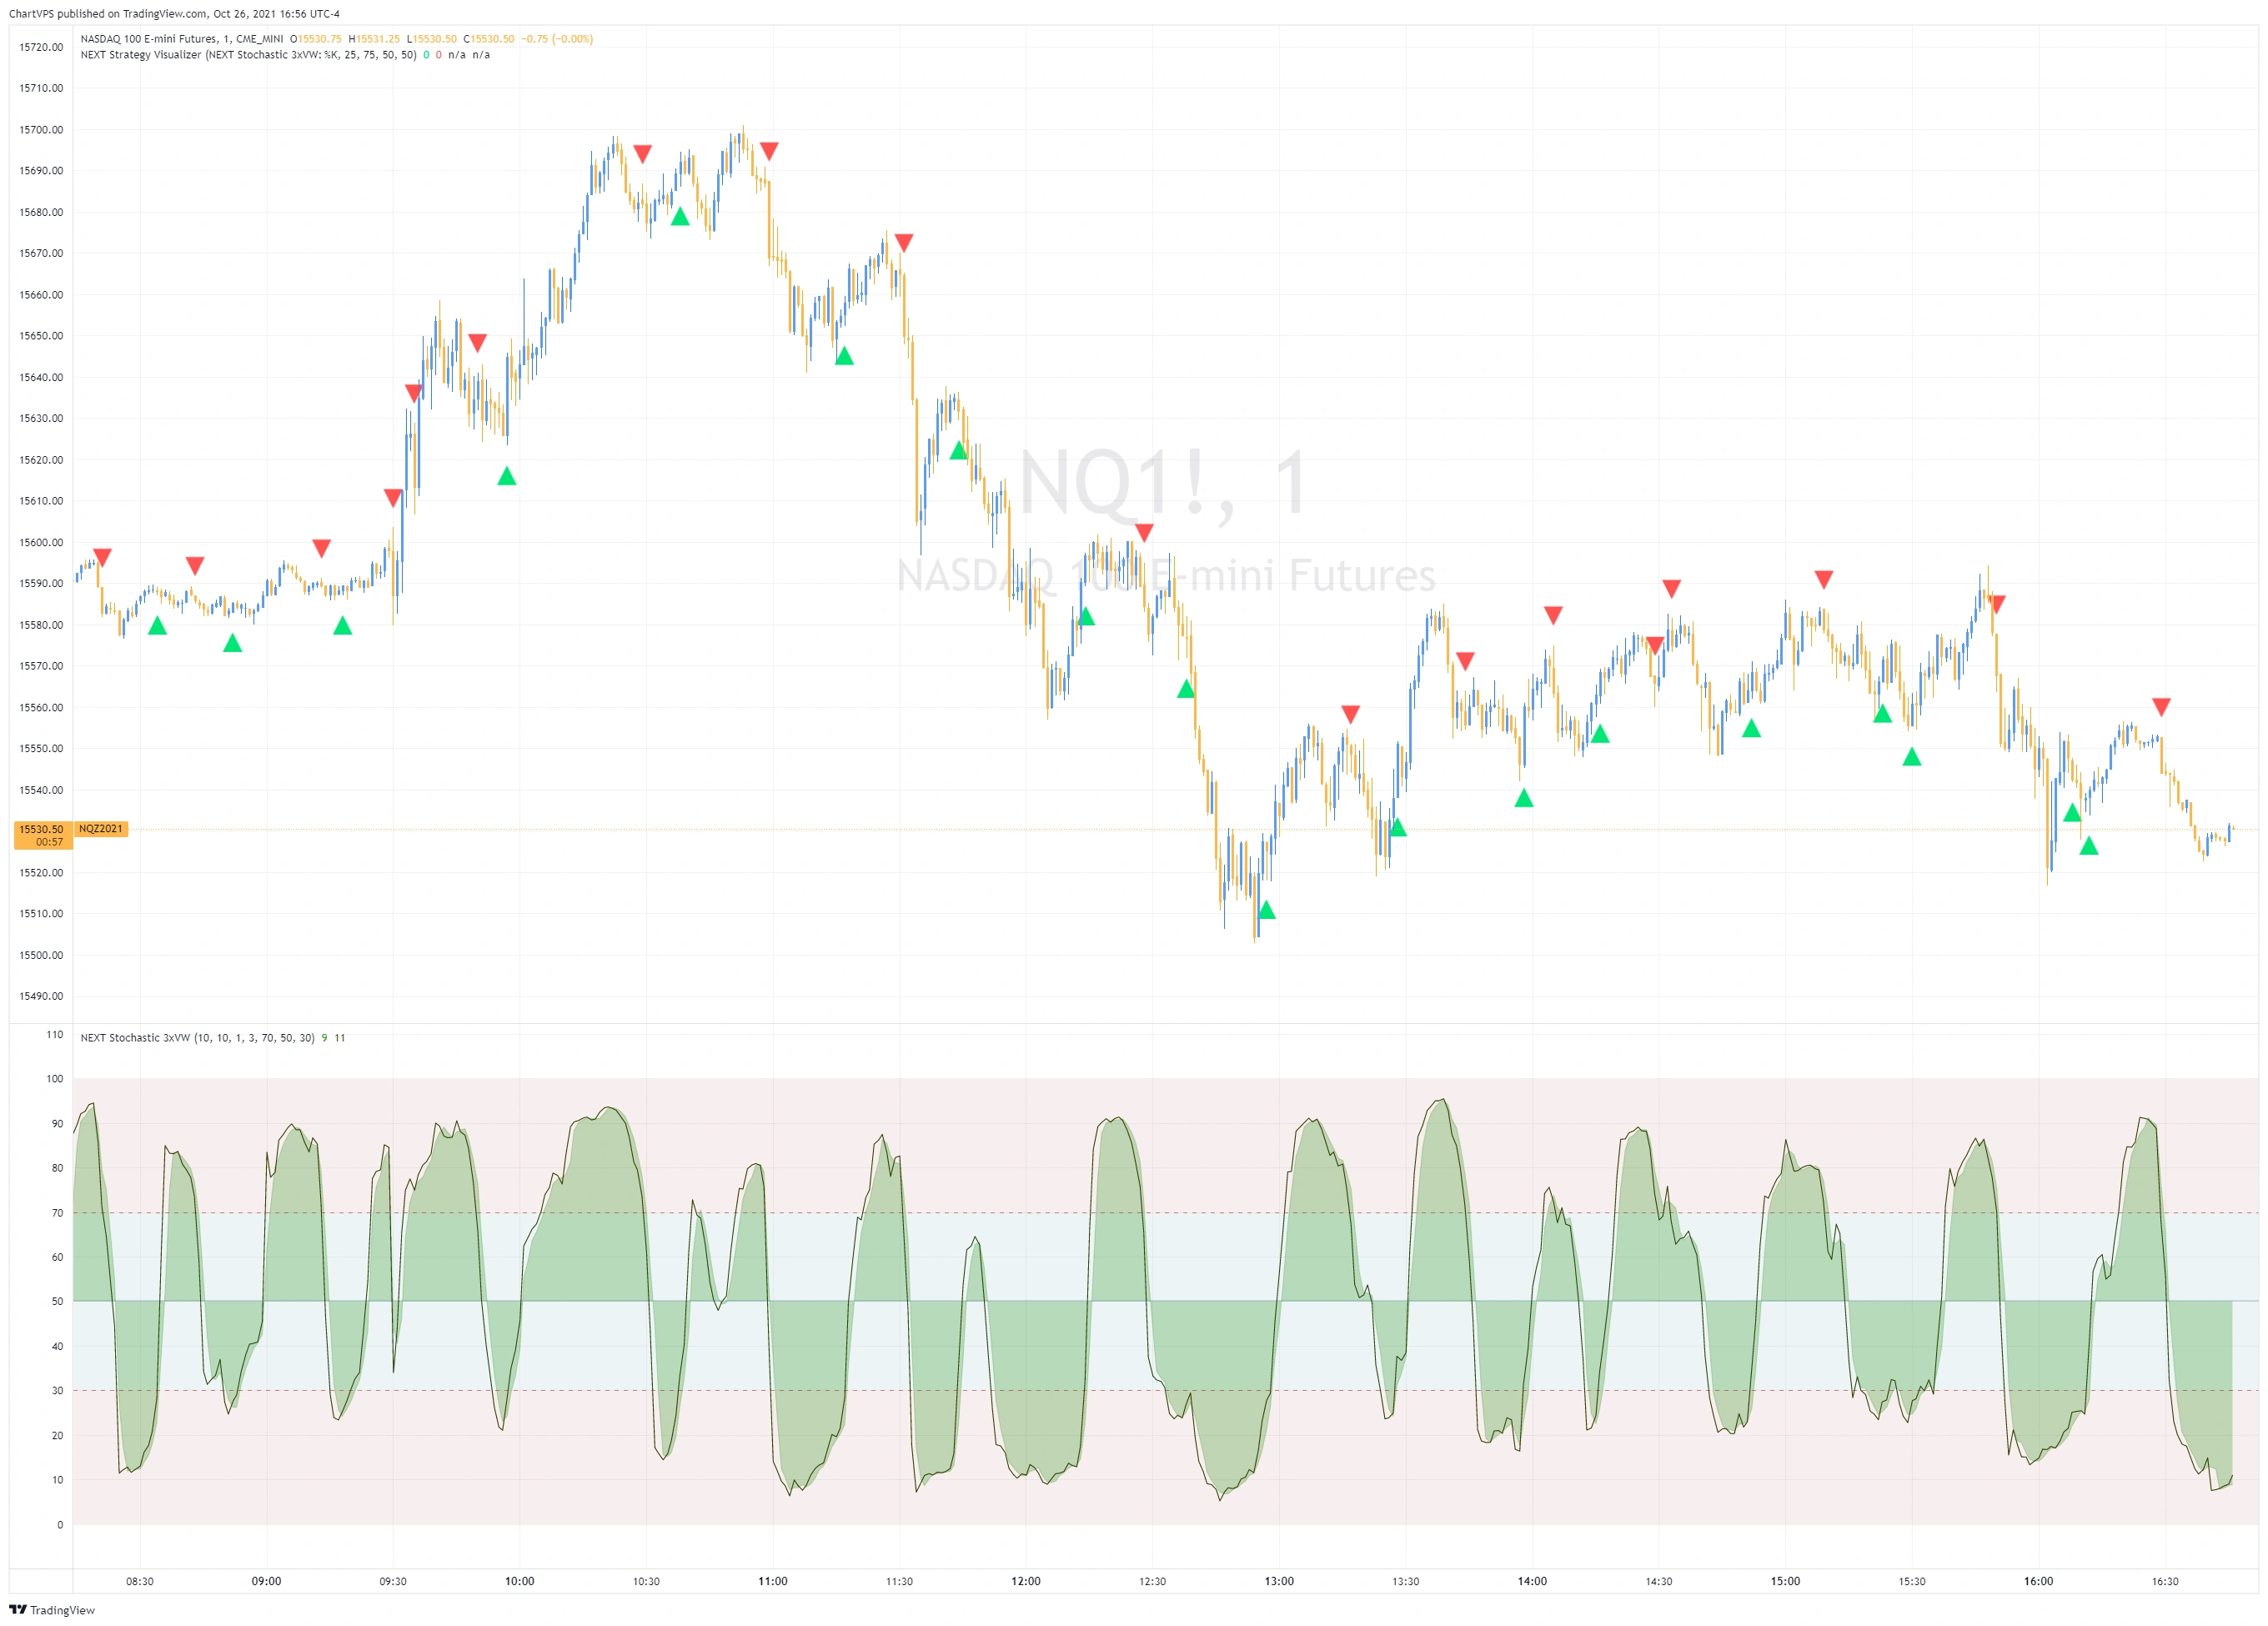
Similar to other momentum oscillators, NEXT Stochastic 3xVW can be used as an aid to trade momentum – going short when Stochastic 3xVW enters overvalued territory (typically 80), going long when it enters undervalued territory (typically 20). The example above is a NEXT Stochastic 3xVW momentum play strategy on SPY (ETF) M1 chart – short when Stochastic 3xVW crosses under 70 (overvalued level); long when it crosses over 30 (undervalued level). NEXT Stochastic 3xVW is set to 5,10,1,3. Since this is contra-trend strategy, TP/SL/trailing stops should be used. Alternatively, use %K/%D line crossovers to exit. Below are the same settings on EURUSD M15.
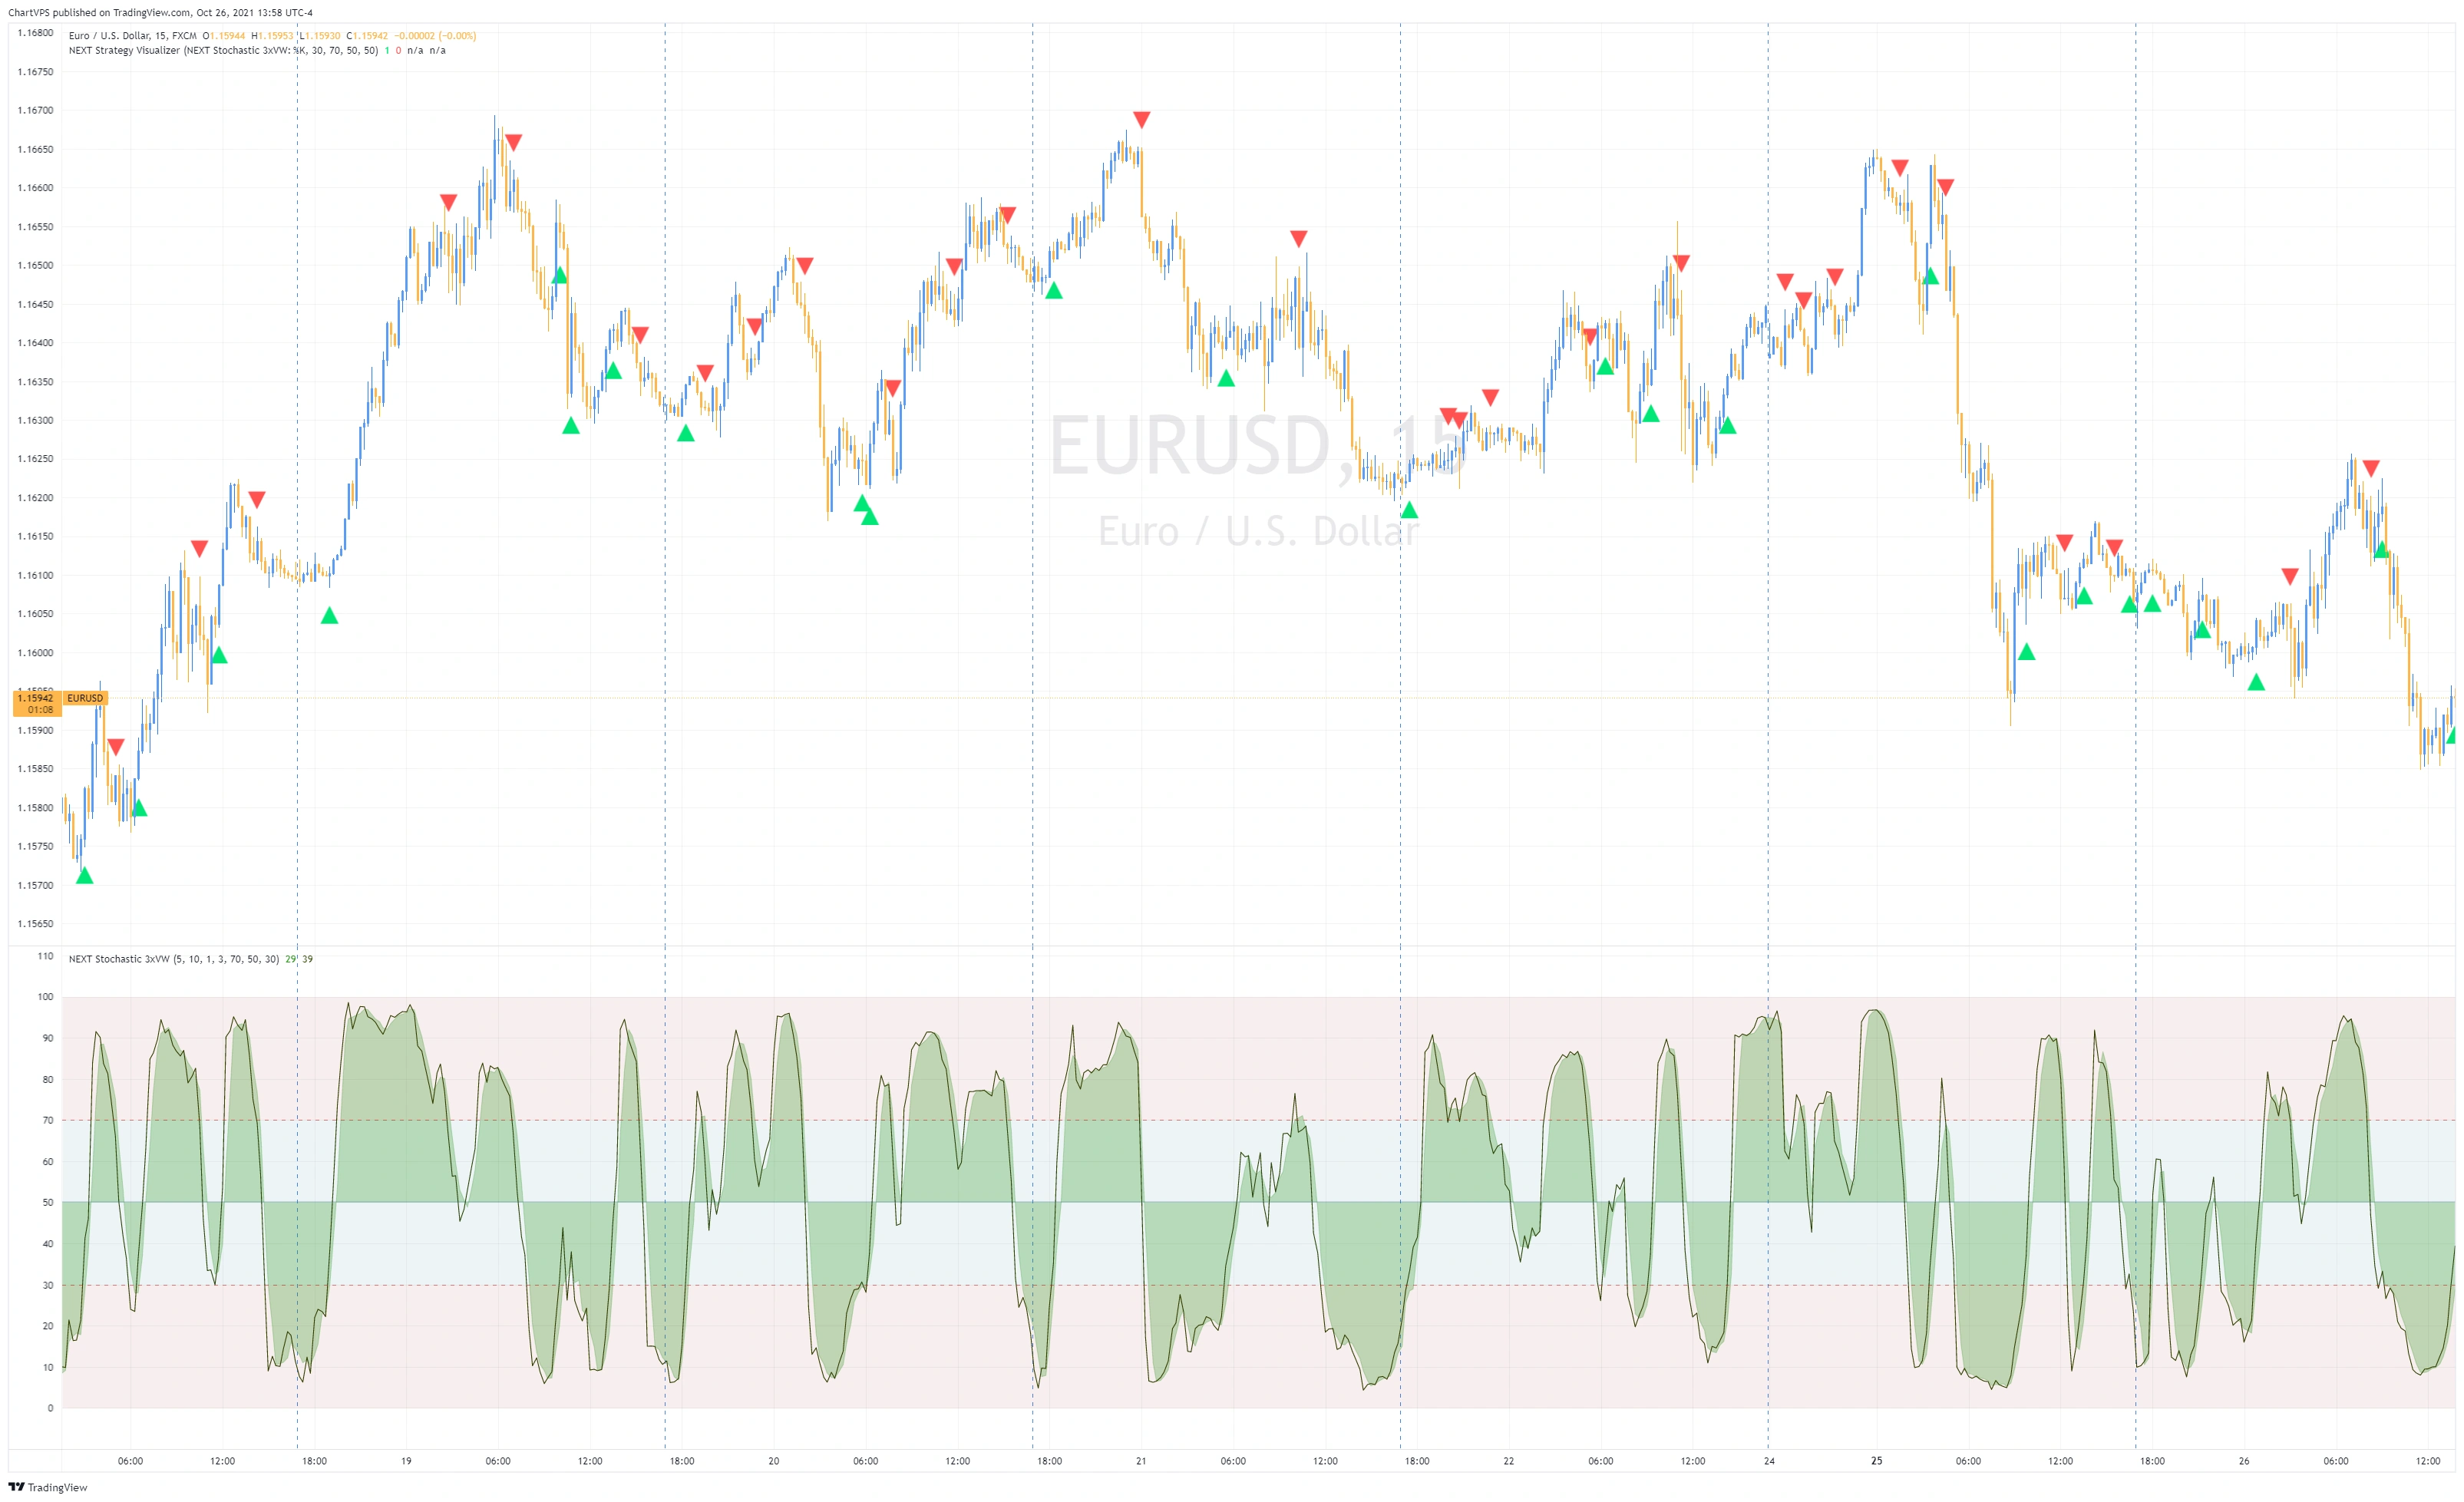
Plotting of signals is achieved via NEXT Stochastic 3xVW’s companion add-on: NEXT Strategy Visualizer.
Trading %K/%D Crossovers
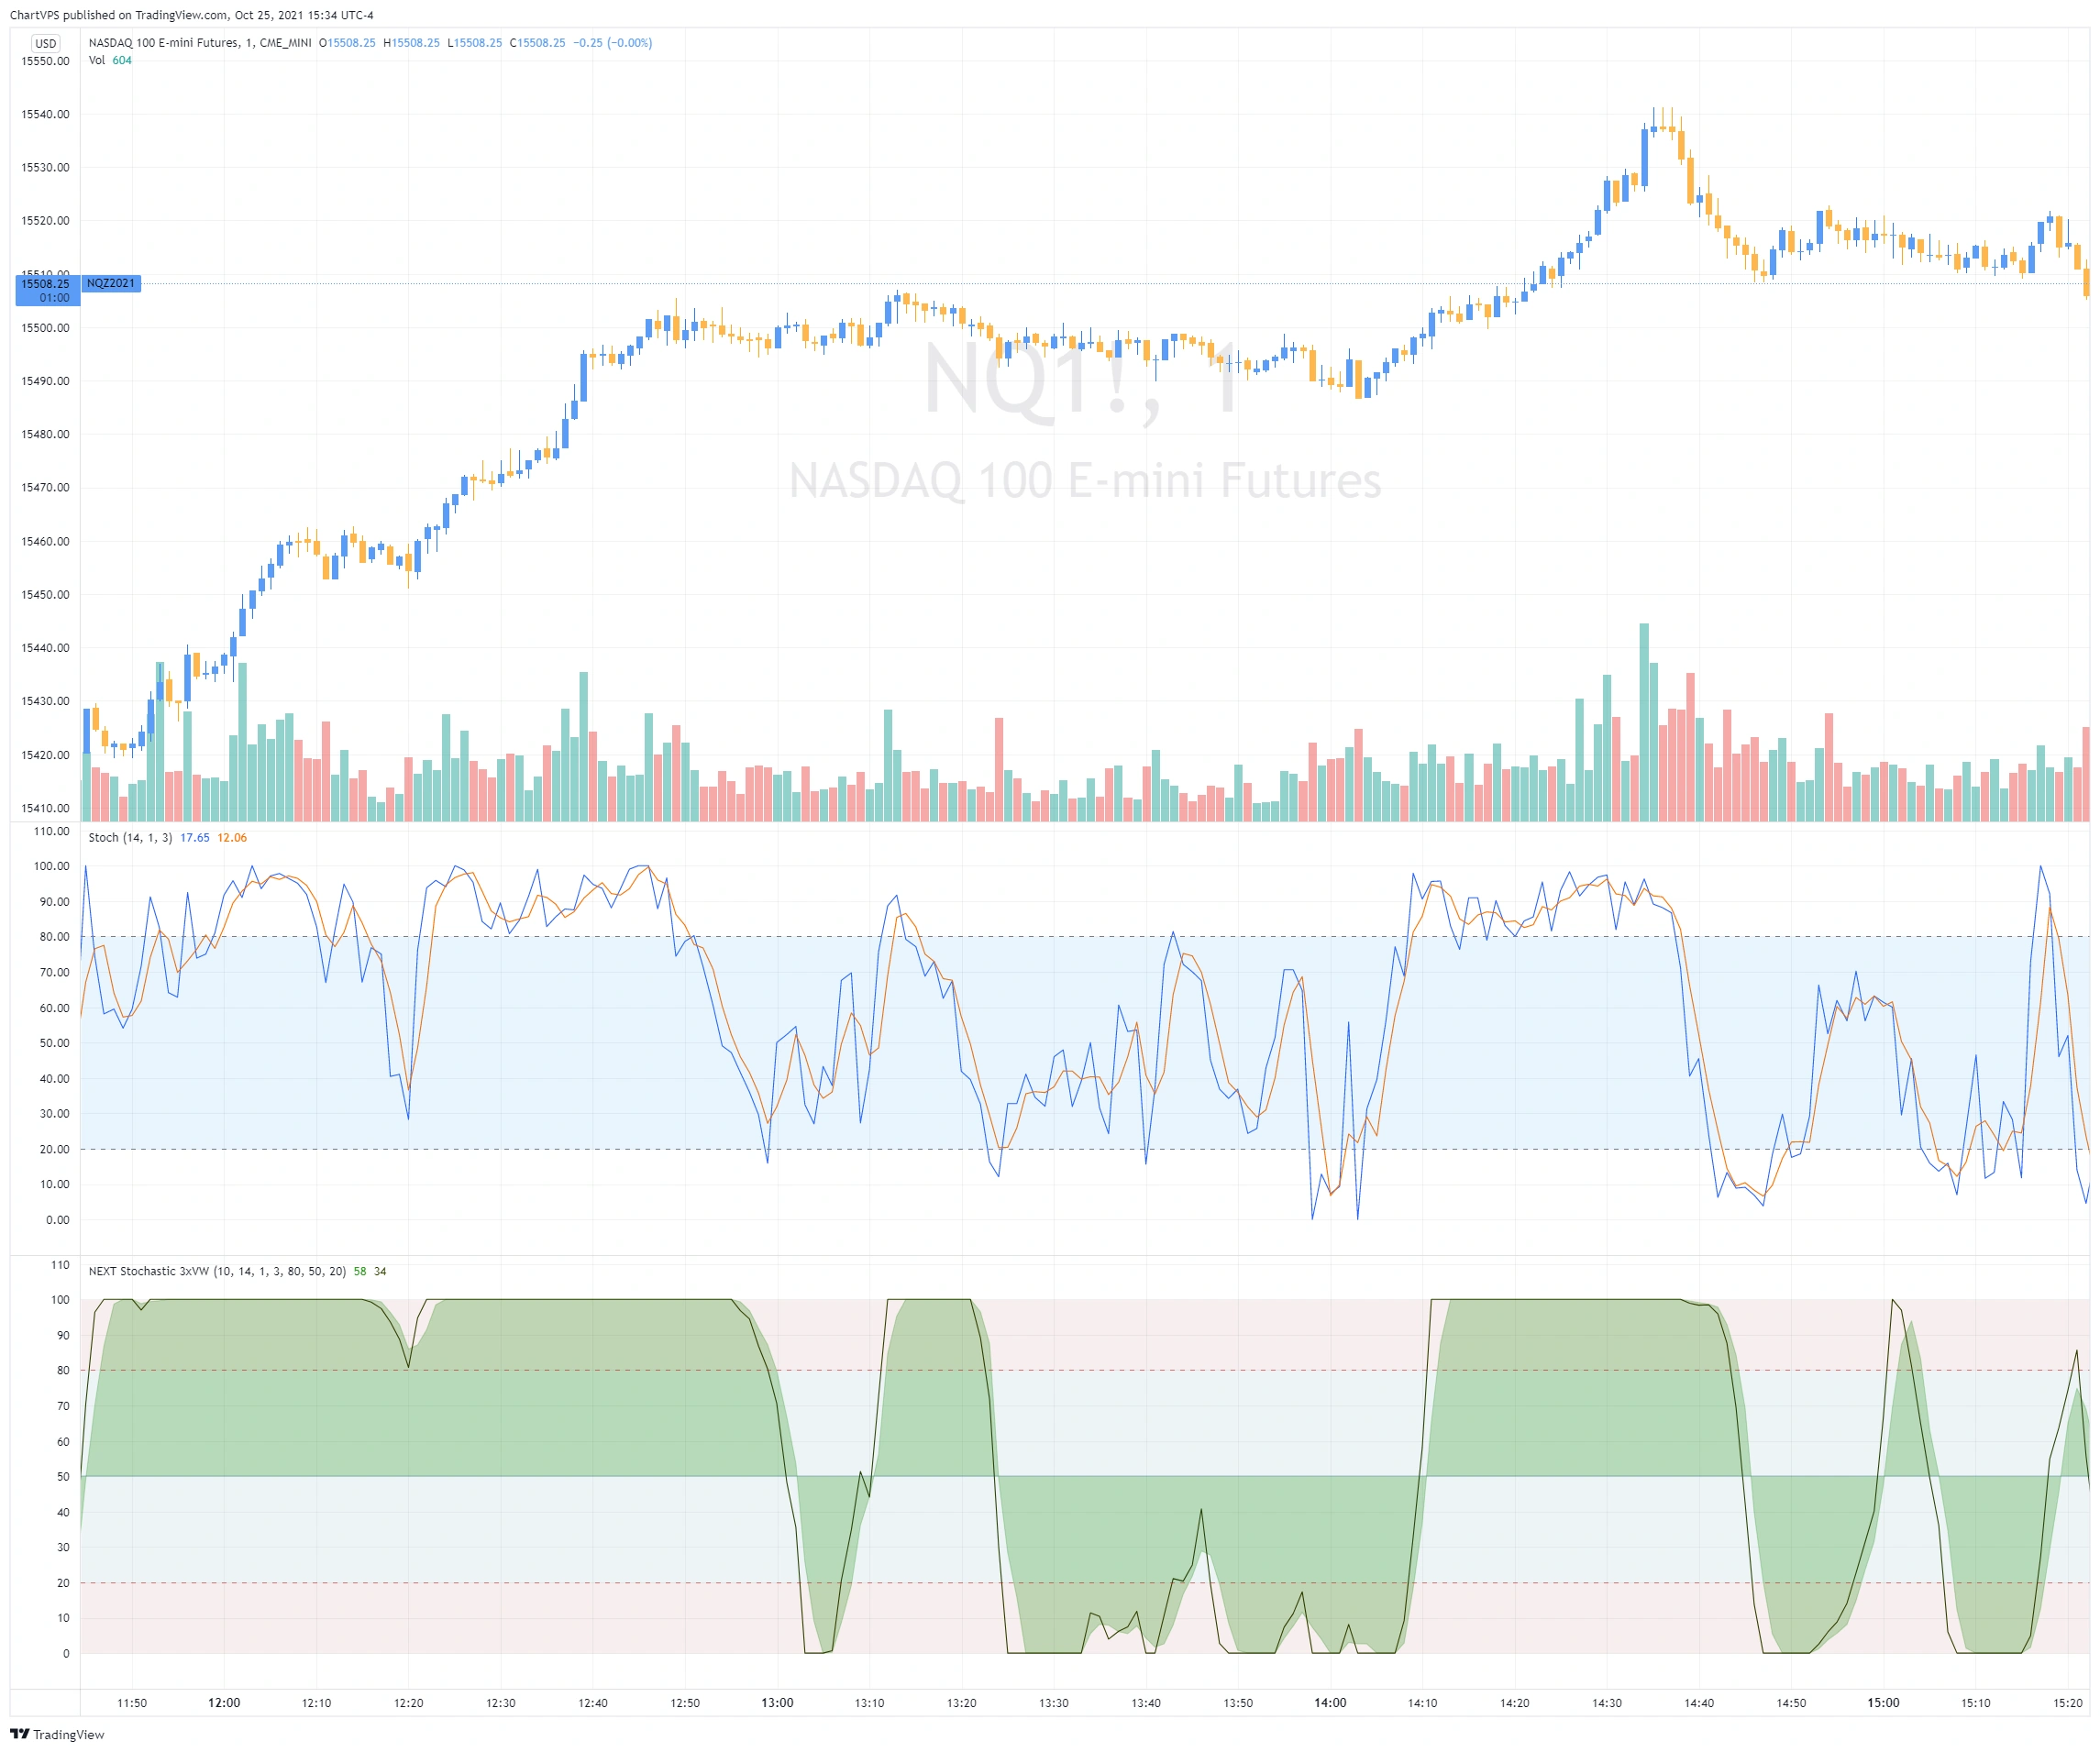
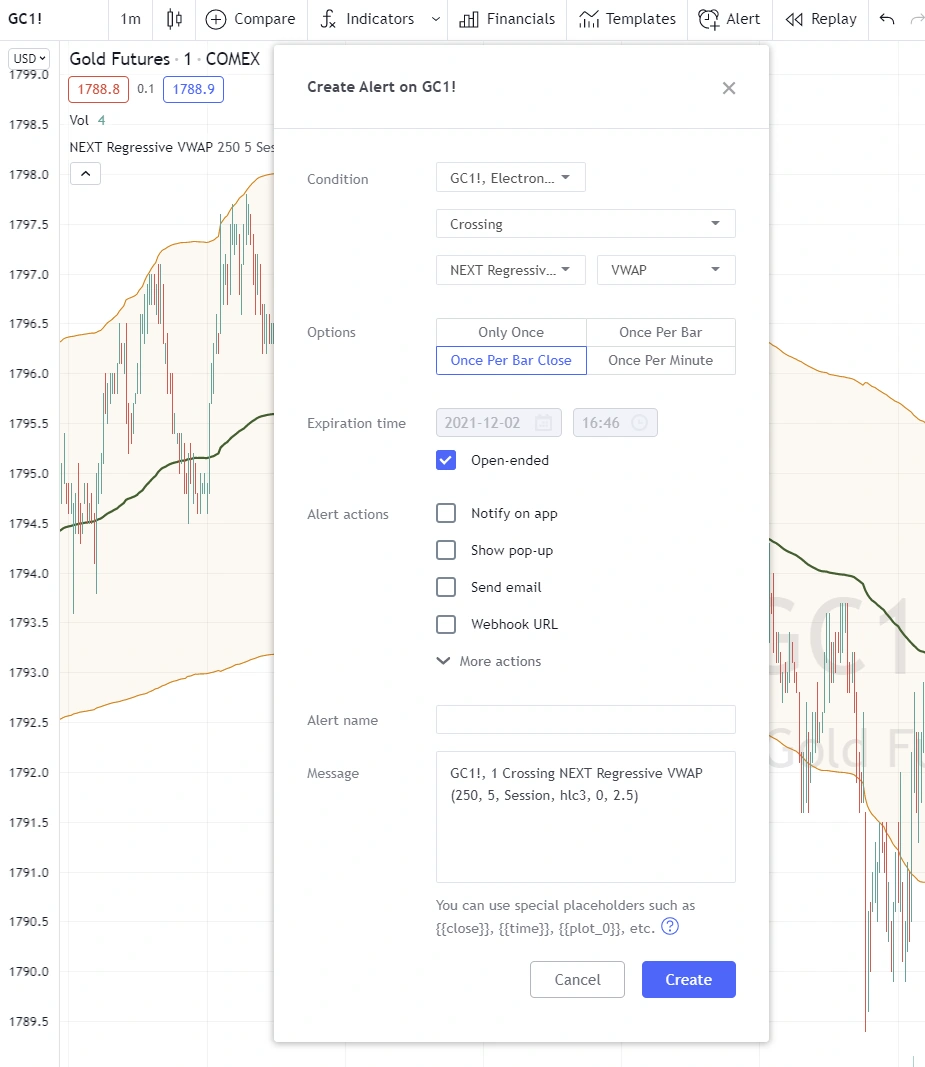
Another popular strategy is to trade the faster moving %K Stochastic line with the slower %D line. This can easily be accomplished via TradingView’s built-in Alert function (right click on chart -> Add Alert). Under Condition section enter the following inputs, left to right: Next Stochastic 3xVW -> %K -> Crossing -> Next Stochastic 3xVW -> %D. Then tick Open-ended under the Expiration time section. You’ll be alerted each time the two lines cross. The screenshot below illustrates what was just said.
Download
TradingView is our platform of choice for publication of the NEXT framework (indicators, strategies, etc.). The platform is free to use (Basic plan) with optional paid features, if you need them. You don’t for NEXT when using a single chart. Their fair approach to empowering retail traders aligns with ours. Trading should not be exclusive to hedge fund managers and professional traders. You can find all of our algo-driven software on the ChartVPS TradingView Scripts page. If you do decide to go with a paid version of TradingView (not required for ChartVPS NEXT), you can use this link to get up to $30 off.